Data Visualization
Exemplifying skill in utilizing data elements, along with other visuals, creating memorable and educational infographics.
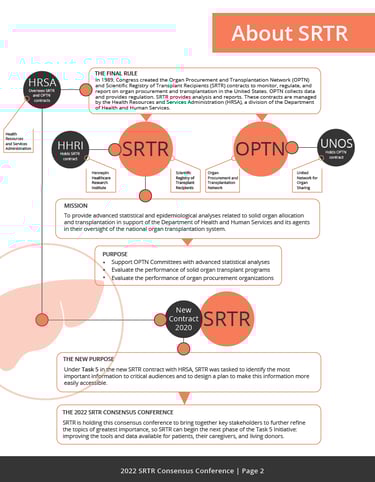
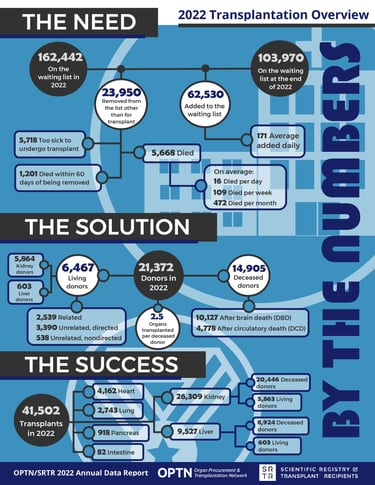
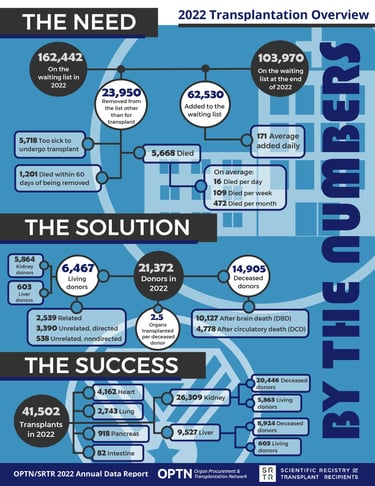
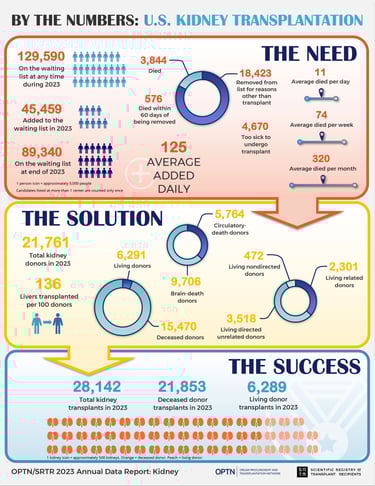
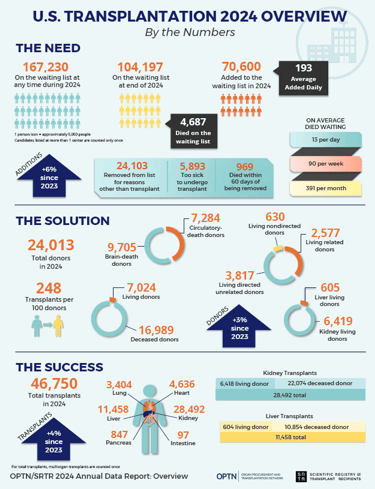
Created infographics for the SRTR Annual data report covering six organ chapters as well as one "overall" report, for the years 2021-2024.
Developed additional data visualization graphics for various applications.
All data visualizations and infographics were created from the ground up, typically using Microsoft Word, then converted to PDF format for easy review and edits.
The process involved researching visual styles and data representations, such as graphs and charts, which would attract attention while accurately and clearly communicating the message.
Subsequently, I produced three to four prototypes, from which management selected their preferred styles.
Once finalized, the infographics went through multiple review and editing stages with input from stakeholders at various levels before completion.
The SRTR ADR Infographics have been published in the American Journal of Transplantation.

Amy E. Ketterer
Expert visual design.
CONTACT
+1.763.360.5536
© 2025. All rights reserved.
FOLLOW
Visual Identity
Logos & Icons
Infographics